

The American Customer Satisfaction Index (ACSI®): Quarter 2, 2026
Economic Alarm Bells are Blasting – Is Anybody Listening?
- The correlation between corporate profit and customer satisfaction is turning increasingly negative, with potentially severe adverse consequences for U.S. economic growth and consumer welfare.
- Customer complaints are at record levels
- If and when the now looming pent-up customer defection materializes, companies with weak or declining customer satisfaction will bear the brunt of the revenue loss.
As of the second quarter of 2026, the American Customer Satisfaction Index (ACSI®) declined sharply, the size of which was surpassed only once before in this century – when the COVID-19 pandemic caused major supply shortages and led to large price increases.
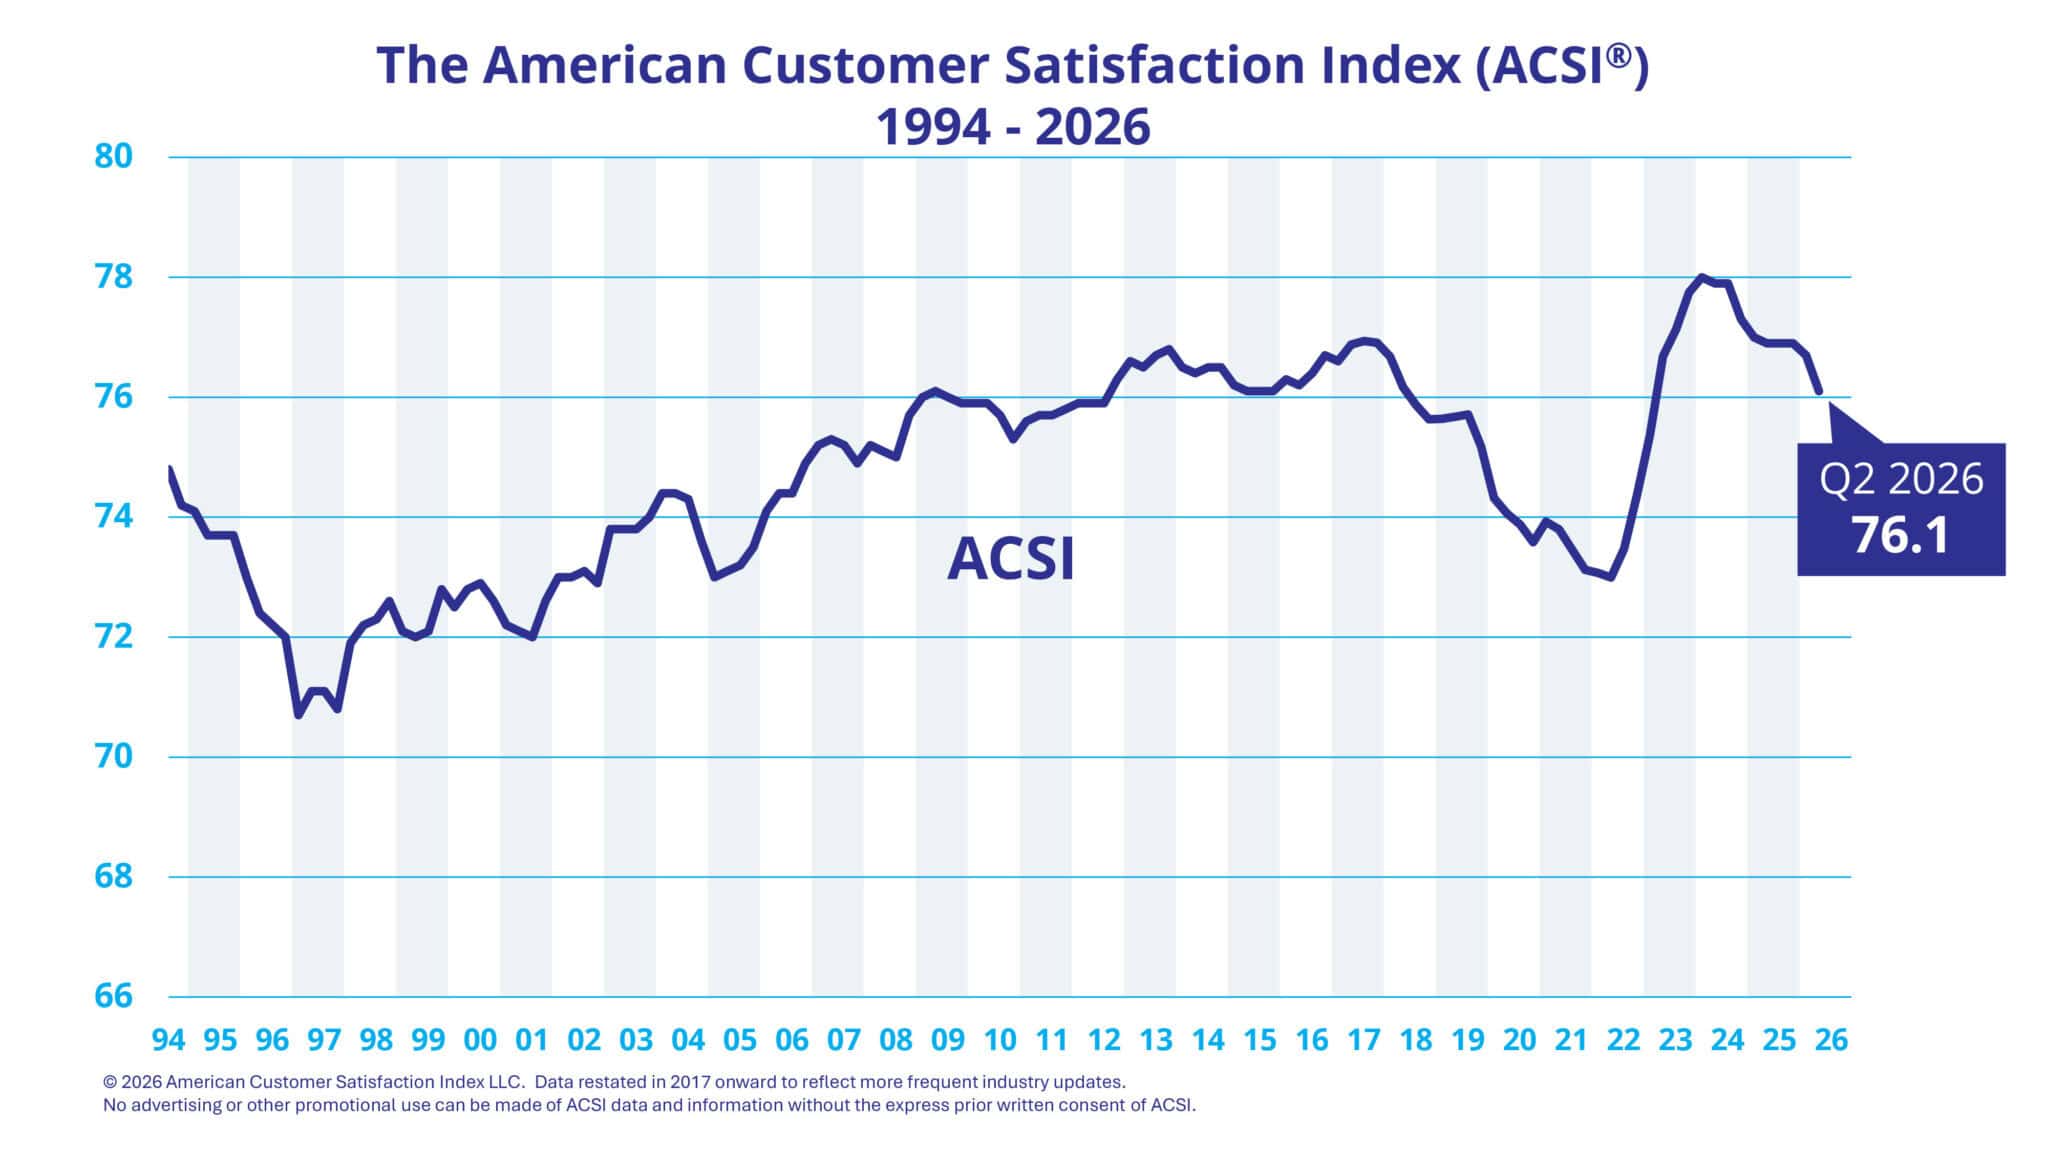
At an annual rate of just 1.5%, GDP growth is also weak. GDP is highly dependent on consumer spending, which is its largest component. Yet despite continued inflation and weaker customer satisfaction, consumer spending has increased, driven by a small proportion of affluent households. Without this increase, GDP growth would have been negative. According to the U.S. Bureau of Economic Analysis, pretax corporate profits are at record levels, but per ACSI data, so are customer complaints. This is a dangerous combination because pent-up customer defection now looms even more treacherous than before. If realized, it would create a complicated challenge, with potentially severe consequences for companies with weak customer satisfaction that have relied on pricing power and benefited from high customer switching costs.
This risk can only be mitigated by improving the buying and consumption experience of customers, using analytics compatible with the properties of customer satisfaction data and performance metrics linked to financial results. However, many companies use performance metrics that are too noisy or irrelevant for improving customer satisfaction. While some accurately predict directional change in customer experience, stock returns, or profit about 50% of the time, so would a coin toss.
At the macro level, the divergence between buyer utility (or satisfaction) and seller profit implies that companies are charging more while supplying less. This creates a welfare loss in economic terms, with profits disproportionately going to owners of capital. It is incompatible with sustainable economic growth and occurs due to market concentration, where companies have strong pricing power and customers face significant switching costs.
Is anybody listening to the warning signs? Customer satisfaction is falling and becoming more compressed across companies. And while customer complaints have reached record heights, market concentration has increased with weak economic growth and ongoing high inflation. In fact, some are listening and not only taking precautionary action, but reaping abnormally high returns to boot. Consider this: Despite a weak economy, the S&P 500 is at a record high due to record profits. Nevertheless, year-to-date the ACSI ETF, which holds about 30-35 top customer satisfaction companies in their respective markets, has outperformed the S&P 500. Apparently, a few companies and investors have recognized the economic peril and acted accordingly.
If the pent-up customer defection materializes, companies with both high customer satisfaction and high customer retention will benefit not only from downside protection, but also from strong stock returns. It is customer retention, particularly at high levels, that causes exponential profit growth. Long term, it is better that such growth comes from satisfied rather than captive customers. Similarly, for long-term economic growth, the negative correlation between corporate profits and customer satisfaction must be reversed. Record seller profits and record buyer complaints are not a sign of a healthy economy.
Claes Fornell, the Donald C. Cook Distinguished Professor of Business (Emeritus) at the University of Michigan, is the primary author of this press release. According to Google Scholar, Professor Fornell is the most cited person in the world on customer satisfaction and one of the most cited econometricians/statisticians with respect to structural equation models with unobservable variables and measurement error. He holds honorary doctorates from several universities.
| 1st Quarter | 2nd Quarter | 3rd Quarter | 4th Quarter | |
|---|---|---|---|---|
| 2026 | 76.7 | 76.1 | – | – |
| 2025 | 77.0 | 76.9 | 76.9 | 76.9 |
| 2024 | 78.0 | 77.9 | 77.9 | 77.3 |
| 2023 | 75.4 | 76.7 | 77.1 | 77.8 |
| 2022 | 73.1 | 73.0 | 73.5 | 74.4 |
| 2021 | 73.9 | 73.8 | 73.5 | 73.1 |
| 2020 | 74.3 | 74.1 | 73.9 | 73.6 |
| 2019 | 75.6 | 75.7 | 75.7 | 75.2 |
| 2018 | 76.7 | 76.2 | 75.9 | 75.6 |
| 2017 | 76.6 | 76.9 | 76.9 | 76.9 |
| 2016 | 76.3 | 76.2 | 76.4 | 76.7 |
| 2015 | 76.2 | 76.1 | 76.1 | 76.1 |
| 2014 | 76.5 | 76.4 | 76.5 | 76.5 |
| 2013 | 76.6 | 76.5 | 76.7 | 76.8 |
| 2012 | 75.9 | 75.9 | 75.9 | 76.3 |
| 2011 | 75.6 | 75.7 | 75.7 | 75.8 |
| 2010 | 75.9 | 75.9 | 75.7 | 75.3 |
| 2009 | 76.0 | 76.1 | 76.0 | 75.9 |
| 2008 | 75.2 | 75.1 | 75.0 | 75.7 |
| 2007 | 75.2 | 75.3 | 75.2 | 74.9 |
| 2006 | 74.1 | 74.4 | 74.4 | 74.9 |
| 2005 | 73.0 | 73.1 | 73.2 | 73.5 |
| 2004 | 74.4 | 74.4 | 74.3 | 73.6 |
| 2003 | 73.8 | 73.8 | 73.8 | 74.0 |
| 2002 | 73.0 | 73.0 | 73.1 | 72.9 |
| 2001 | 72.2 | 72.1 | 72.0 | 72.6 |
| 2000 | 72.5 | 72.8 | 72.9 | 72.6 |
| 1999 | 72.1 | 72.0 | 72.1 | 72.8 |
| 1998 | 71.9 | 72.2 | 72.3 | 72.6 |
| 1997 | 70.7 | 71.1 | 71.1 | 70.8 |
| 1996 | 73.0 | 72.4 | 72.2 | 72.0 |
| 1995 | 74.1 | 73.7 | 73.7 | 73.7 |
| 1994 | – | – | 74.8* | 74.2 |
*Baseline measurement taken in summer 1994
While companies today have more data about their customers, the analytics employed to turn data into information are for the most part not good enough. Customer satisfaction data have certain characteristics that make it difficult to obtain accurate estimates, to pinpoint what aspects of the customer experience need attention, and to gauge the financial impact of actions contemplated. Traditional statistical methods assume normal frequency distributions among the residuals, moderate multicollinearity, and low levels of data noise. Customer satisfaction data don’t meet these assumptions.
ACSI Analytics is designed to overcome these problems and thereby turning raw data into financially relevant information by:
- Separating signals from noise
- Moving from correlations and artificial intelligence (AI) patterns to cause-and-effect interpretations
- Calibrating measurement instruments toward profitability
Data is not the same as information—especially not data from consumer surveys. Management decisions require information; raw data must be filtered in order to be useful for decision-making. ACSI technology filters out data noise.
Management decisions require cause-and-effect information—something that current CX tools, whether based on AI or descriptive statistics, don’t provide. ACSI Analytics, on the other hand, is based on a causal model.
There is a wide disparity in the amount of consumer data collected by companies today. Some data suppliers use surveys with more than 200 questions per respondent, while others focus on responses to a single question. Neither is appropriate. Excessively long surveys may lead to straight-line responses. Good measurement techniques—whether in the social or physical sciences—typically require several measures (survey questions in this case) per product feature or service dimension.
Accuracy and relevance are what matters. To contribute to the business objectives at hand, the measurement instruments need calibration in ways similar to the physical sciences. This is why companies with high scores in the American Customer Satisfaction Index, which is calibrated to maximize customer loyalty, are financially successful, most notably in terms of stock returns and profitability.
No advertising or other promotional use can be made of ACSI data and information without the express prior written consent of ACSI LLC.