
The American Customer Satisfaction Index (ACSI®) is designed to identify changes in customer satisfaction that are most closely associated with customer retention. Strong and improving loyalty can support revenue growth and profitability while reducing business risk. The ACSI Leaders portfolio applies this signal by selecting 30 to 35 of the highest-scoring companies within their industries and weighting them based on the relationship between satisfaction and retention. Historically, this approach has produced above-market returns with lower downside sensitivity.
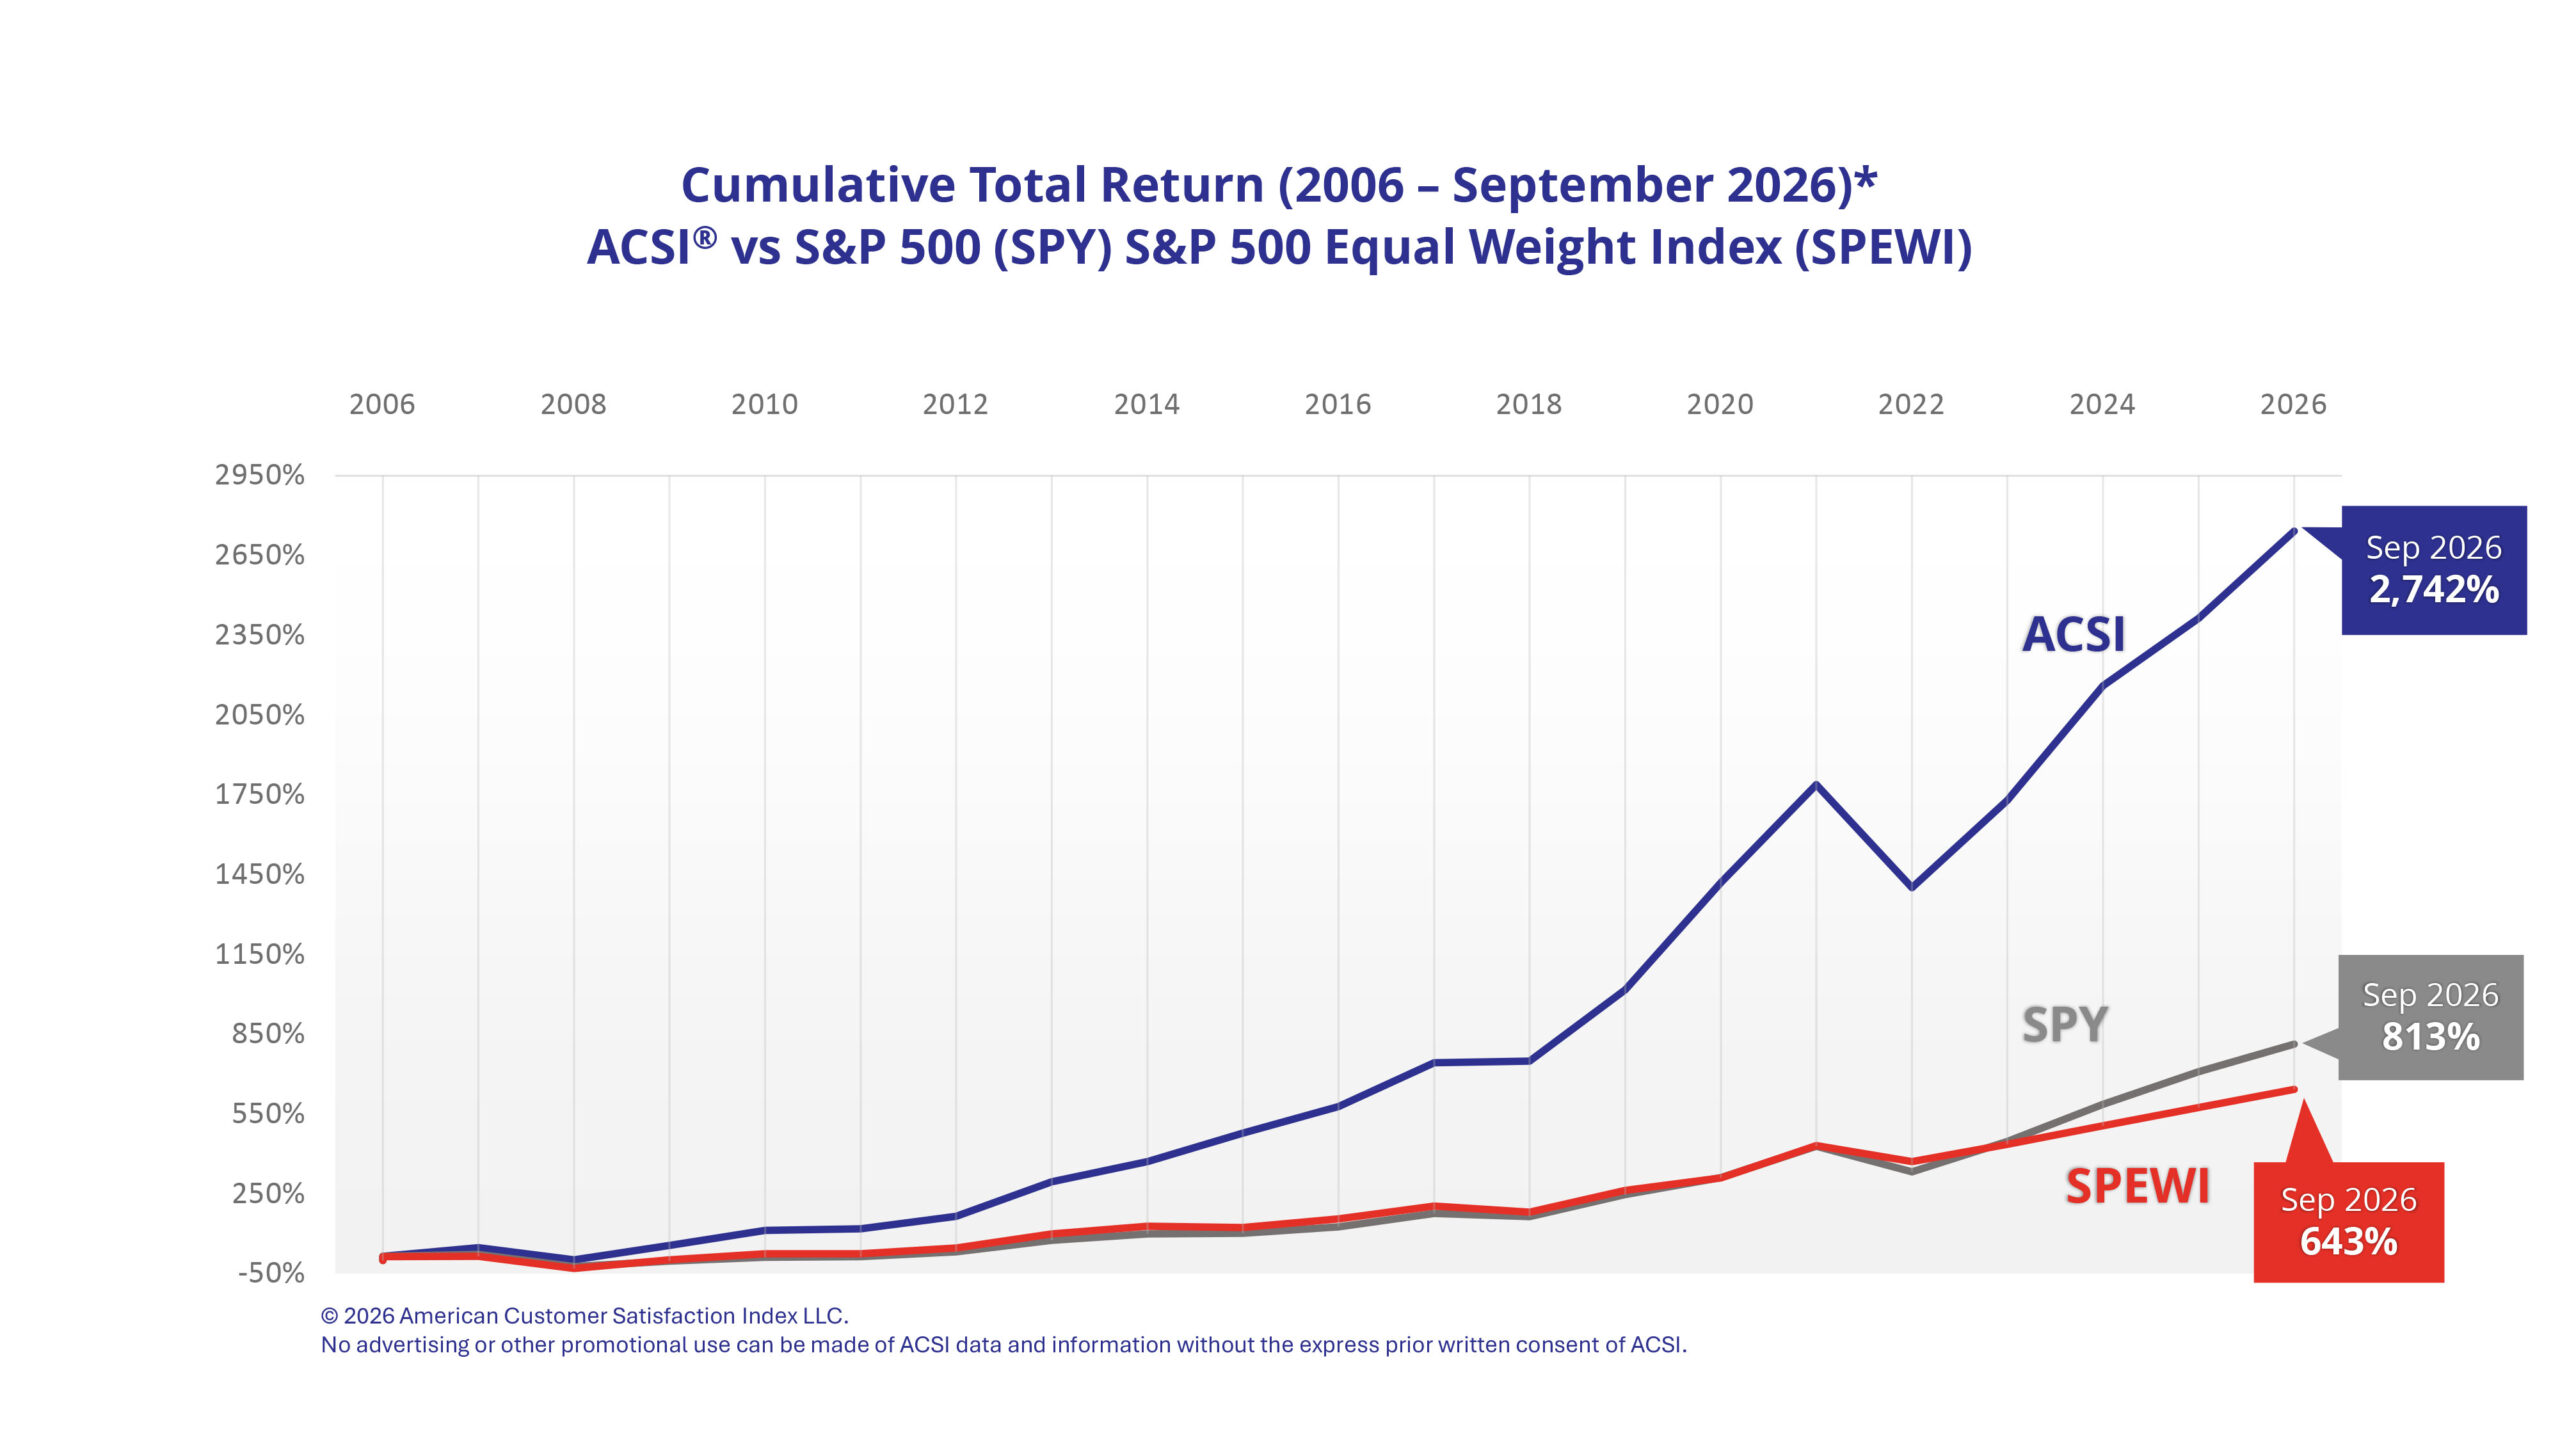
From January 2006 through September 2026, the ACSI Leaders portfolio generated a cumulative total return of 2,742%, compared with 813% for the S&P 500 and 643% for the S&P 500 Equal Weight Index. These results correspond to annualized returns of 17.5% for ACSI Leaders, 11.3% for the S&P 500 and 10.15% for the equal-weight index.
Why benchmark choice matters
The cap-weighted S&P 500 has become increasingly concentrated in its largest companies, with performance heavily influenced by mega-cap technology and the AI and data-center investment cycle. That structure can make it a less representative benchmark for portfolios that do not share the same sector and style exposures. The S&P 500 Equal Weight Index therefore provides a useful complementary comparison.
Performance since 2023
From January 2023 through September 2026, the ACSI Leaders portfolio gained 89.2%, compared with 56.7% for the S&P 500 Equal Weight Index, a lead of 32.5 percentage points. Risk-adjusted results also favored ACSI over this period. Its Sharpe ratio was 0.99 versus 0.63 for equal weight, while its Sortino ratio was 2.00 versus 1.01. Importantly, the ACSI leadership portfolio showed an up-market beta of 1.04 and a down-market beta of 0.67, and the portfolio captured approximately 60% of the equal-weight index’s downside. The underlying mechanisms on consumer loyalty and retention created a surfing beta that not only participated, but benefited from up market moves, while providing some downside protection
YTD – Q3 2026 results
The ACSI Leaders portfolio returned 13.0% through the first nine months of 2026, outperforming the S&P 500’s 12.7% return and the S&P 500 Equal Weight Index’s 10.0%. During the third quarter, continued strength in mega-cap technology narrowed ACSI’s lead over the S&P 500, while its relative performance against the equal-weight index improved.
Strong stock selection drove the portfolio’s relative results, adding 8.67 percentage points and offsetting a significant 8.29-point drag from sector allocation. The portfolio held less exposure to strong-performing Information Technology and Energy and more exposure to lagging Consumer Discretionary and Communication Services, but overcame that headwind via good stock selection within industries.
Technology holdings provided the largest selection benefit, with portfolio holdings returning 81.0% versus 28.9% for the benchmark sector. That performance more than offset the technology underweight, producing a net contribution of 2.24 percentage points to relative return. Health Care was the largest net sector contributor at 2.32 points, followed by Technology and Financials, which added 1.42 points. Consumer Discretionary was the largest detractor, reducing relative return by 4.61 points as both the overweight and stock selection weighed on results.
At the company level, Dell Technologies, contributed 9.19 percentage points while Humana added 2.10 points, with Apple, Alphabet and Toronto-Dominion Bank also top 5 contributors. Nike and Chewy were the largest detractors, reducing portfolio return by 1.42 and 1.08 points, respectively.
The portfolio achieved its overall return with slightly lower realized volatility and a smaller maximum drawdown than the S&P 500. Annualized volatility was 12.8%, compared with 13.2% for the index, while maximum drawdown was 7.8% versus 8.9%.
The role of competitive markets
The relationship between customer satisfaction and excess returns depends on competitive markets, where companies are rewarded for retaining satisfied customers and penalized when they fail to do so. While that relationship can weaken temporarily, it has generally remained a meaningful force in the United States and an important foundation for durable economic growth.
For more information on ACSI as a financial signal, please contact Josh Blechman [email protected].